Q2 insights and analysis on trends in paid search, SEO, social media, product listing ads, comparison shopping engines, display advertising and more.
In our mobile-driven
world, when it comes to insights and analysis on trends
in paid search, SEO, social media, product listing ads, comparison shopping
engines, display advertising and more, across the world, it is not surprising
to observe that, Image-based and Video-based product ads continue to see much
higher growth than traditional text ads.
It is also exciting to observe that, Smartphone clicks grew year-over-year,
compared to tablets and a decline for desktop.
As part of our global commitment, Connectikpeople.co soon #Retinknow®, has
captured for you a Digital Marketing Report from a full-service digital marketing agency, RKG, a Merkle
company.
Covering the second quarter of 2014, this report which leverages data
across RKG client base, including 50 of the IR Top 500 Retailers, shows that, U.S.
paid search spending growth accelerated during the second quarter.
Search advertiser spending on product ads in Q2 rose 72% over last year,
while text ad spending grew just 6%. PLA share of total Google clicks remained
steady from last quarter, at 26% of overall paid search clicks and 50% of
non-brand clicks.
According to the RKG data, PLAs (Products Listings Ads) are not well-monetized
on search partners, producing just 7% of total search partner clicks, compared
to 26% of all clicks on Google.com.
The Google Display Network (GDN) accounted for 6% of total Google spending,
the same rate as the previous quarter.
Other Notable Q2 Highlights captured by Connectikpeople.co soon #Retinknow® include:
Paid Search
- Google paid search spending grew 24% Y/Y in Q2, as paid clicks rose 13% and CPC rose 10%.
- Bing Ads search spending grew 19% Y/Y, led by a 22% increase in paid clicks. Bing Ads CPCs fell 3%, due to a mix shift to mobile.
- Advertiser spending on Google Product Listing Ads (PLAs) and Bing Product Ads rose 72% over last year.
- Smartphones generated 19% of paid search clicks and 9% of search spend, while tables produced 18% of clicks and 19% of spend.
Organic Search & Social
- Organic search produced 31% of all site visits in Q2 2014, which was down from 36% in the first half of 2013. As the major search engines work to better monetize their listings with larger and more appealing ads, organic search volume will continue to get squeezed in favor of paid.
Comparison Shopping Engines
- Share of total CSE spend going to Amazon dropped from 17% in Q2 of last year to 9% in Q2 of 2014 as large advertisers were moved out of Amazon Product Ads by Amazon, ostensibly to encourage them towards the Amazon Marketplace.
- Among advertisers running both Amazon Product Ads and Google PLAs, revenue volume from Amazon’s program was just 7% that of PLAs, down from 9% in Q1.
Display Advertising
- For advertisers actively advertising on the Google Display Network (GDN) and running AdWords paid search ads, GDN accounted for 6% of total Google spending, the same rate as the previous quarter.
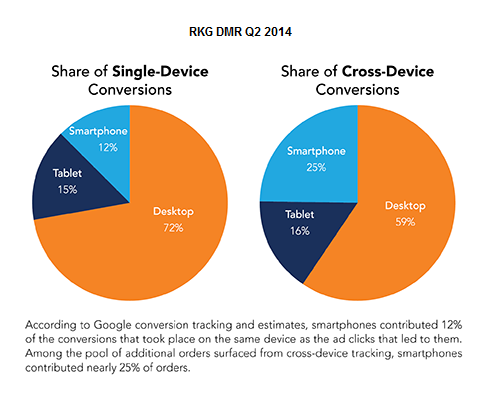
RKG, a Merkle company, also recalls that, while smartphones produce 12% of
traditionally tracked conversions, they contribute nearly 25% of cross-device
orders.